Statserver: Setting up Monitoring & Statistics with Ansible
Daan Debie / March 02, 2014
11 min read
Monitoring and statistics are an indispensable part of the DevOps toolchain. Collecting and monitoring metrics used to be solely the domain of system engineers/system administrators and IT operations people. But nowadays, tools like StatsD make it almost trivial to measure anything and everything - and by extension monitor anything - on the application level, and that makes it the responsibility of developers as well. This is not only a prerequisite for a healthy application environment and infrastructure, it can be incredibly fun as well!
One problem, however, is that it’s not really easy to get started with tools like StatsD and Graphite because installing those tools is hardly trivial. Getting it to work locally, on your development machine, can be a messy affair. And when you’re convinced that you should be doing this measurement and monitoring stuff in production and you’ve convinced the ops department and your boss of the benefits as well, it can be hard to set it up the right way for production use, with the right database, the right web-proxy, etc.
Because I wanted to become a responsible developer, and have a complete measuring and monitoring solution for my own projects, I decided to cook up a Playbook in Ansible, that installs the following tools and its dependencies:
- StatsD
- Graphite
- Sentry
This provides you with the capabilities to measure anything you want in your application and otherwise, collect it with StatsD and store and visualize it with Graphite. As an added bonus, Sentry provides you with a way to collect and monitor the exceptions that occur in your applications.
This post is both a guide to using the Ansible Playbook (skip to Installation instructions) and a detailed write-up of my experience with Ansible.
My Requirements
I had the following requirements when setting this up:
- Works both locally using Vagrant and on a "real server", by using the Playbook standalone
- Works on different Linux distros, arbitrarily chosen by me as the most "common": Ubuntu, Debian and CentOS. Support for CentOS means that it will probably work on other RedHat-a-likes as well.
- It’s configured for production use. That means: a real database (no SQLite), no silly portnumbers trailing your URLs, no using built-in Django servers, etc.
Installation
For people who are only interested in getting up-and-running, I’ll first continue with the installation instructions. If you want to install this on a real server, you’ll only need Ansible. Instructions for installing Ansible, can be found on their website, but I’ll sum up here how I’d recommend installing Ansible:
- Linux: Use PIP to install Ansible by running
sudo pip install ansible. - OS X: Install Ansible with Homebrew by running
brew install ansible. Installation using Homebrew PIP (you’re not using OS X’s default Python, are you?) doesn’t work because of hardcoded paths. - Windows: Please get yourself a proper development machine. (Windows isn’t supported)
If you want to try Statserver out locally, on a virtual machine, you’ll need Vagrant and a Virtual Machine provider of choice (VirtualBox is free and works out of the box with Vagrant).
After meeting the requirements, clone the repo:
$ git clone https://github.com/DandyDev/statserver
$ cd /path/to/statserver
You should now edit the statserver.yml file and modify a few variables:
graphite > server: The hostname of the URL on which you want to access Graphite. For running a local VM, graphite.local is fine. In production, this could be something like graphite.mystatserver.com.db_graphite > password: a secure password for the Graphite databasedb_sentry > password: a secure password for the Sentry databasesuperuser_sentry > email, username, password: details of the Sentry superuser account that will automatically be createdsentry > server: The hostname of the URL on which you want to access Sentry. For running a local VM, sentry.local is fine. In production, this could be something like sentry.mystatserver.com.sentry > url: This should be set to the value you set for thesentry > servervariable, prefixed with the desired protocol (http or https)
Now, for creating a VM locally to try this out, you can do the following:
$ echo "192.168.33.30 graphite.local" >> /etc/hosts
$ echo "192.168.33.30 sentry.local" >> /etc/hosts
$ vagrant up
For provisioning a remote server with Sentry, StatsD and Graphite, do the following:
# replace mystatserver.com with the domainname or IP address on which your server can be reached.
$ echo "mystatserver.com" >> myinventory
$ ansible-playbook statserver.yml -i myinventory
Within 5 − 10 minutes or so, you should be able to access Graphite and Sentry on the specified url’s.
If you’re happy with the results, and want something to measure, you can start by adding Diamond to all your servers. This will send all kinds of nifty system metrics to your statserver. Be sure to configure it to send its metrics to StatsD instead of Graphite, for less overhead.
For a guide on how to do meaningful measurements in your applications, have a look here: http://matt.aimonetti.net/posts/2013/06/26/practical-guide-to-graphite-monitoring/
Components
The installation consists of the following components:
- PostgreSQL database
- Nginx webserver/reverse proxy
- Python, Pip & VirtualEnv
- NodeJS
- Memcached
- The 3 core Graphite components:
- StatsD
- The latest stable version of Sentry and all of its Python dependencies
Why Ansible?
If you look at my Github repos and/or blog, you’ll notice my efforts in doing something similar with only Sentry, using Puppet. So why did I choose Ansible now?
A few reasons:
- At work we started using Ansible, replacing a lot of what was previously done with Puppet. Puppet is now only used to manage basic stuff that’s similar across all servers: firewall rules, OS updates & patches, basic packages etc. All other package installs, application installs, and sometimes deployments, are done with Ansible now.
- In my previous efforts, I discovered I kind of dislike Puppet syntax. I really love the simple structure of Ansible Playbooks, written in YAML.
- Writing Puppet scripts, quickly dissolves into a dependency hell because you have to specify each dependency between tasks. Puppet will try to optimize provisioning, by running tasks concurrently. Ansible runs the tasks in written order, which makes it much easier to reason about.
- Ansible is written in Python, which I’ve mastered infinitely better than Ruby, in which Puppet is written. This makes it easier to write new modules, should the need arise.
Writing the Playbook
Creating this Playbook provided a great opportunity to learn Ansible, but that also made it quite a challenge. For an easy approach, I decided to divide the work into bite-sized chunks:
- Convert existing Sentry provision scripts from Puppet to Ansible
- Enhance the Sentry Playbook to also work on Debian and CentOS
- Create a Playbook to provision StatsD and Graphite
- Bring the Sentry and Graphite Playbooks together
Figuring Out Ansible and Writing the Sentry Playbook
This was difficult because at this time I didn’t know anything about Ansible. The learning curve was a lot less steep than with Puppet, mostly because YAML is easy to understand and the linear execution of tasks makes reasoning about your scripts easy. I tried to set up the Playbook according to best practises right from the start. I ended up with the following structure:
- 1 Role for each component that gets installed. Examples of Roles: PostgreSQL, Nginx, Python + assorted packages etc.
- Each Role consists, among other things, of a file with tasks that tells Ansible which commands to run, one or more files that need to be copied to the server (example: configuration for PostgreSQL), one or more templates which are the same as files except for the use of variables to make them dynamic (example: Nginx configuration) and a file with handlers, which are commands that Ansible runs conditionally upon completing a task (example: used to restart Nginx and PostgreSQL)
- 1 Playbook (sentry.yml in this case) which ties all Roles together and contains global variables for configuring aspects of the installation.
The way I worked, was as follows:
- Write a role that installs some component.
- Run
vagrant provisionwith Ubuntu image - Correct (m)any mistakes
- See if component works by SSHing to machine and checking if some process runs, pointing browser to URL and checking if website shows etc.
- Repeat 2 − 4
- Change OS image in
Vagrantfileto Debian - Repeat 2 − 4
- Change OS image in
Vagrantfileto CentOS - Repeat 2 − 4
- Try it again on Ubuntu
- (Hopefully not) repeat 2 − 4
- Repeat 1 − 11 for each role
Os Compatibility
One of the major challenges was to make the installation of both Sentry and Grapite/StatsD compatible with Ubuntu, Debian and CentOS. Ubuntu is based on Debian, but has different package repositories. Debian’s package repositories usually contain packages which are more outdated than Ubuntu’s. At one point, when switching from Ubuntu to Debian, Ansible stopped working altogether because the default Debian image provided by Vagrant lacked Python. I solved this by installing Python on it and saving it as a new image.
CentOS has a different package manager (yum) altogether than Debian and Ubuntu (apt) and a lot of packages that are available for Ubuntu and Debian, are not available for CentOS. This problem was solved by adding the EPEL repo to CentOS during the provisioning process.
Another piece of the puzzle is finding out how packages are named for different OSes. Python’s development headers, for instance, are installed as python-dev on Debian and Ubuntu, but are installed as python-devel on CentOS.
Also, not all packages are created equal. Installing PostgreSQL on Debian and Ubuntu gives you an initialized database cluster, proper startup at boot-time and an authentication configuration that works with Django (on which both Sentry and Graphite are based). Installing PostgreSQL on CentOS gets you none of that, so you have to take care of all of that manually. Another example is Nginx, which runs as a different user under Debian/Ubuntu (www-data) than under CentOS (nginx).
Writing the Graphite & Statsd Playbook
After getting Sentry to work from an Ansible Playbook, the language and mechanics of Ansible were more clear to me. Writing a Playbook for Graphite & StatsD posed a whole different set of problems though…
Graphite uses Cairo to draw its charts. Cairo is written in C, but has bindings for Python. Those bindings, py2cairo won’t let themselves get installed in a virtualenv, which I found out through Stackoverflow. The solution is to use the new, pure-python bindings called cairocffi. This is supported by Graphite, but only in the master branch on Github, and not in any officially released version yet. So my only option here was to use the latest Graphite source from github.
StatsD requires NodeJS, for which some repo packages are heavily outdated. My solution? Compile and install NodeJS from source. Luckily, this was fairly trivial and multi-distribution compatible to boot!
Graphite is configured in such a way, as to work together well with StatsD. This is explained nicely on the StatsD wiki from which I took the configuration directly.
Common Components
Some components are used by both Graphite and Sentry. For those, I tried to find roles on Ansible Galaxy, I rather new Role repository. I did find a suitable Role for installing Nginx with Ansible. For PostgreSQL, none of the Roles on Ansible Galaxy suited my needs, mostly because they were not cross-OS compatible. In the end, I rolled my own.
Statserver uses Supervisor for managing processes. For this too, I wrote my own Role. The CentOS/RedHat repos contain an ancient version of Supervisor that gave me quite some problems, so I chose to install Supervisor on CentOS using PIP. For Debian/Ubuntu I stuck with the packages from the OS package repositories.
Putting It All Together
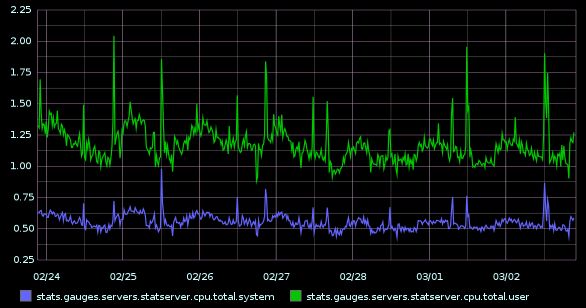
After the Graphite/StatsD Playbook was done, it was a matter of putting both Playbooks together and removing the redundancies. Luckily this posed little to no problems. After thoroughly testing it locally using Vagrant, I provisioned a server on Digital Ocean, which has been running without a glitch for a couple of weeks now:
Github
All of my work as detailed above can be found on Github of course. Statserver, the end result can be found here on GitHub. Or you could use only Sentry or Graphite/StatsD.
Contributions and ideas are welcome!
Happy measuring!